
Three Labels That Keep A Business Story Honest
A buyer-facing page can be accurate in its footnotes and still send the wrong message at first glance.
Imagine a presentation with one large revenue figure. The source is a partial-year statement, but the slide headline reads like a full-year result. The underlying math may be explained elsewhere. The reader should not have to hunt for the time period to understand what the number means.
When I work on a business story, I want three labels visible before anyone argues about the design: what happened, what is estimated, and what is planned.
Actuals Answer What Happened
An actual result needs a defined period and source. “Year to date” is incomplete without an end date. “Last year” is less useful than the exact fiscal year. If I use a chart, the axis and legend should carry the same period as the headline.
That clarity matters beyond finance. Completed projects, operating capacity and customer relationships all have dates and status. A slide should not quietly turn a current snapshot into a durable trend.

A financial story is clearer when the status of each claim is visible on the page. This scene is illustrative.
Estimates Answer A Different Question
An annualized estimate can help a reader understand what a partial year might imply. It is not the same as a reported full-year result. It depends on a method and assumptions. Seasonality, changes in mix and one-time work can all make a straight-line calculation less representative.
I label the estimate in the title or chart itself, then explain the source period and calculation in a note nearby. If the assumptions are too uncertain to support a useful comparison, I would rather show the actual period clearly than force a full-year number onto the page.
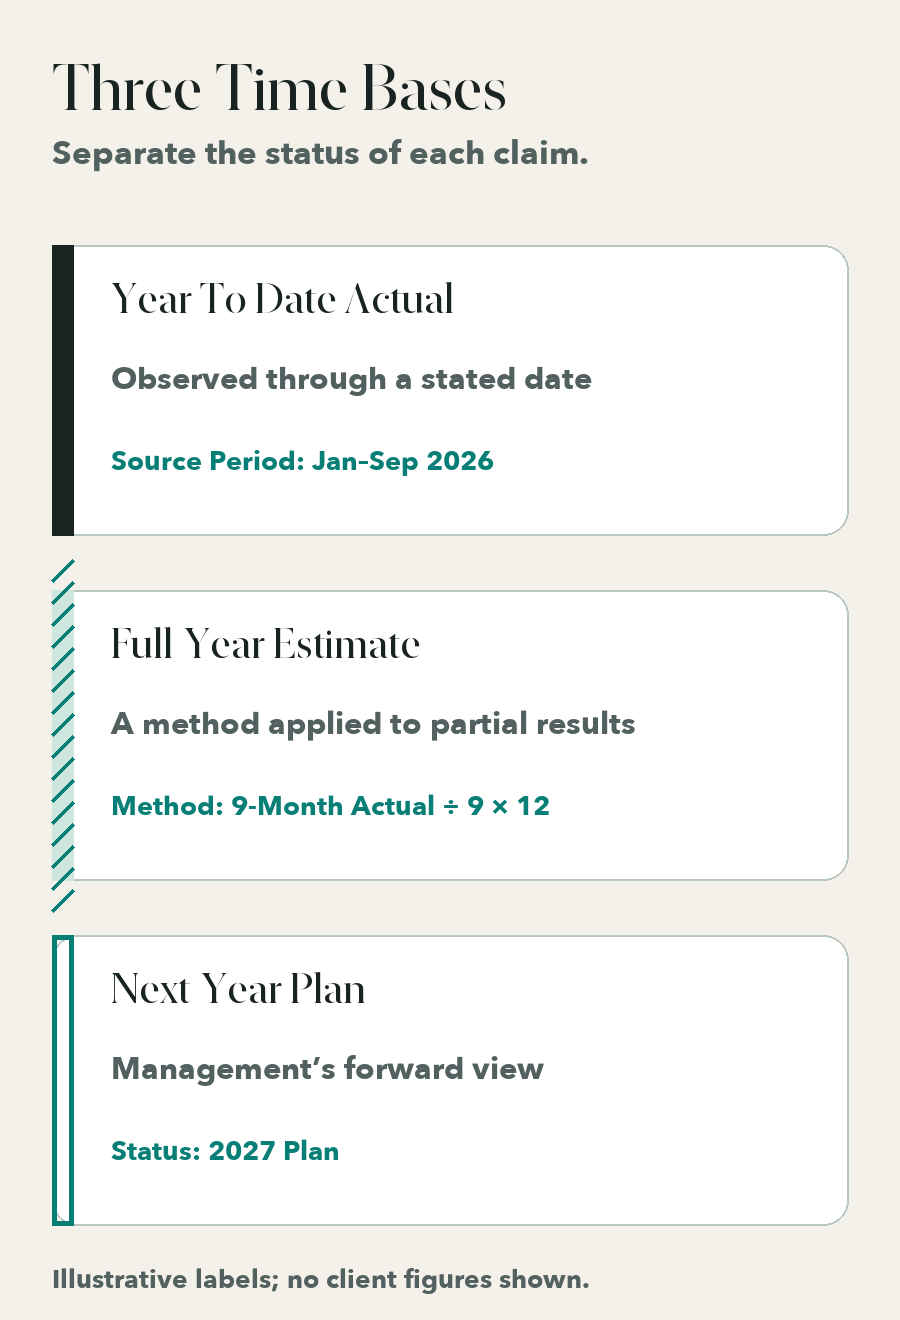
These three views answer different questions and need different labels. The example shows no financial values.
Plans Describe Intent, Not A Result
A plan is a management view of what could happen next if people, capacity and demand line up. It belongs in the story, but it needs its own visual treatment. A solid historical bar beside an identical solid forecast bar makes the two look equally certain. Different shading and explicit labels are clearer.
Opportunity status needs the same discipline. Awarded work is different from an active bid. A useful presentation can discuss both, provided the reader can see which is committed and which is still being pursued.
Here is an illustrative rewrite:
Vague: “The company generated strong full-year revenue and has a growing contracted pipeline.”
Clearer: “The first portion shows actual results through the stated period. The full-year figure is an annualized estimate based on that period. The project list separates awarded work from active bids.”
The clearer version gives the reader enough information to test each claim.
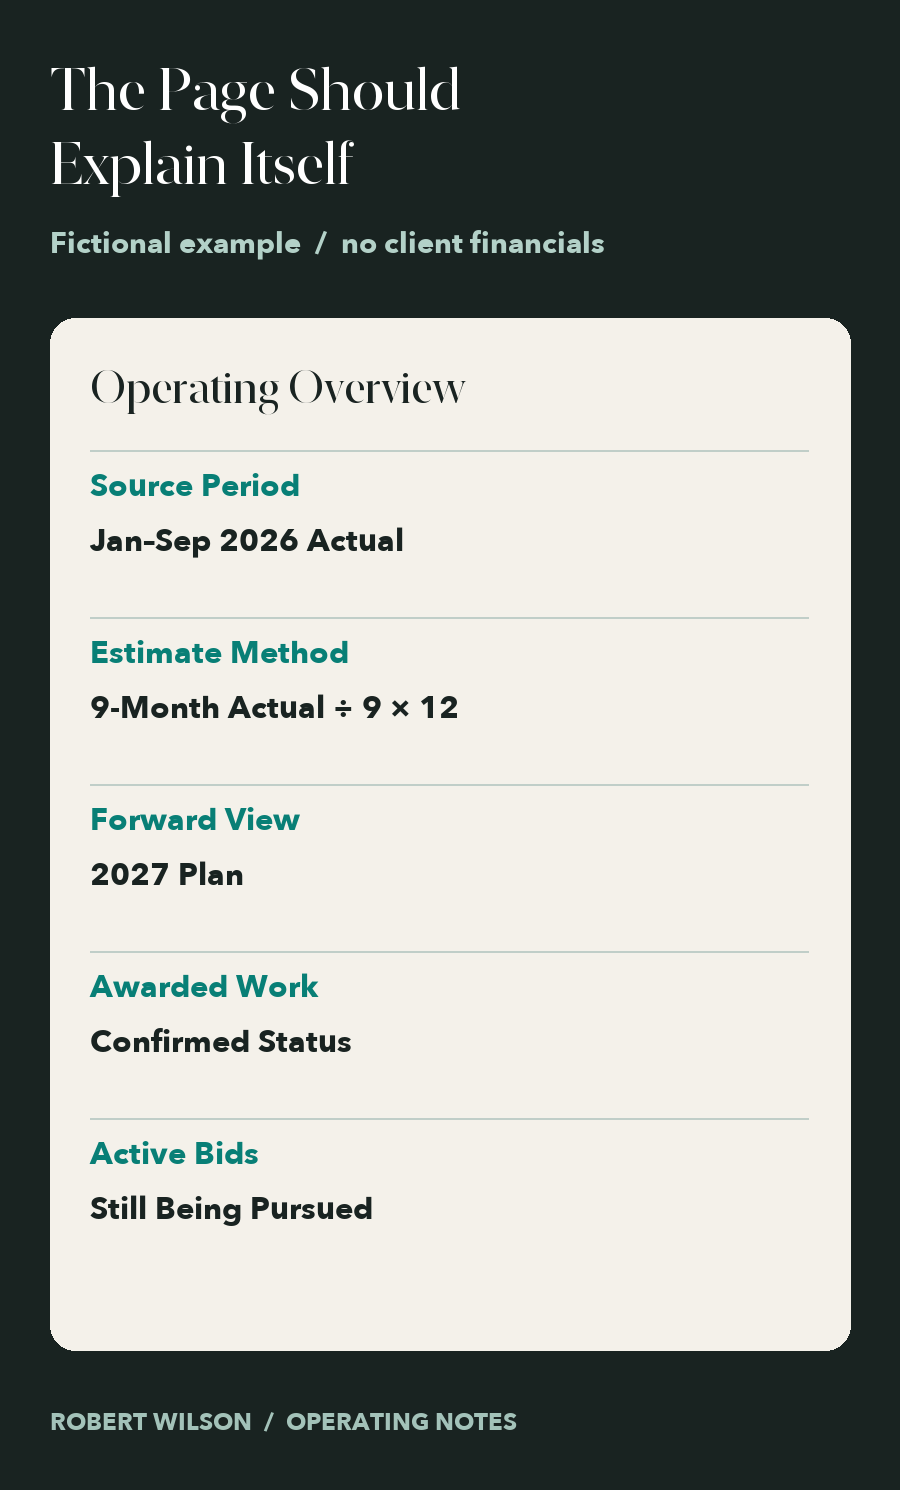
The page should disclose the time basis and opportunity status without a presenter in the room. This example is fictional.
The Page Should Stand On Its Own
Before I send a buyer-facing page, I ask a practical question: if someone sees only this slide in a forwarded PDF, can they tell what is actual, what is estimated and what remains a plan?
If the answer depends on my explanation in the meeting, the page needs another pass.
If you are aligning operating facts, financial analysis and the business story people see, let’s talk.